
Debugging and Troubleshooting Made Simple
Uncover software bugs when HTTP communication is involved. The Fiddler set of tools helps you promptly identify errors to effectively fix them. Easily.
Which Fiddler Do I Need?
Five Products, One Family, Extensive Debugging and Troubleshooting Tools.
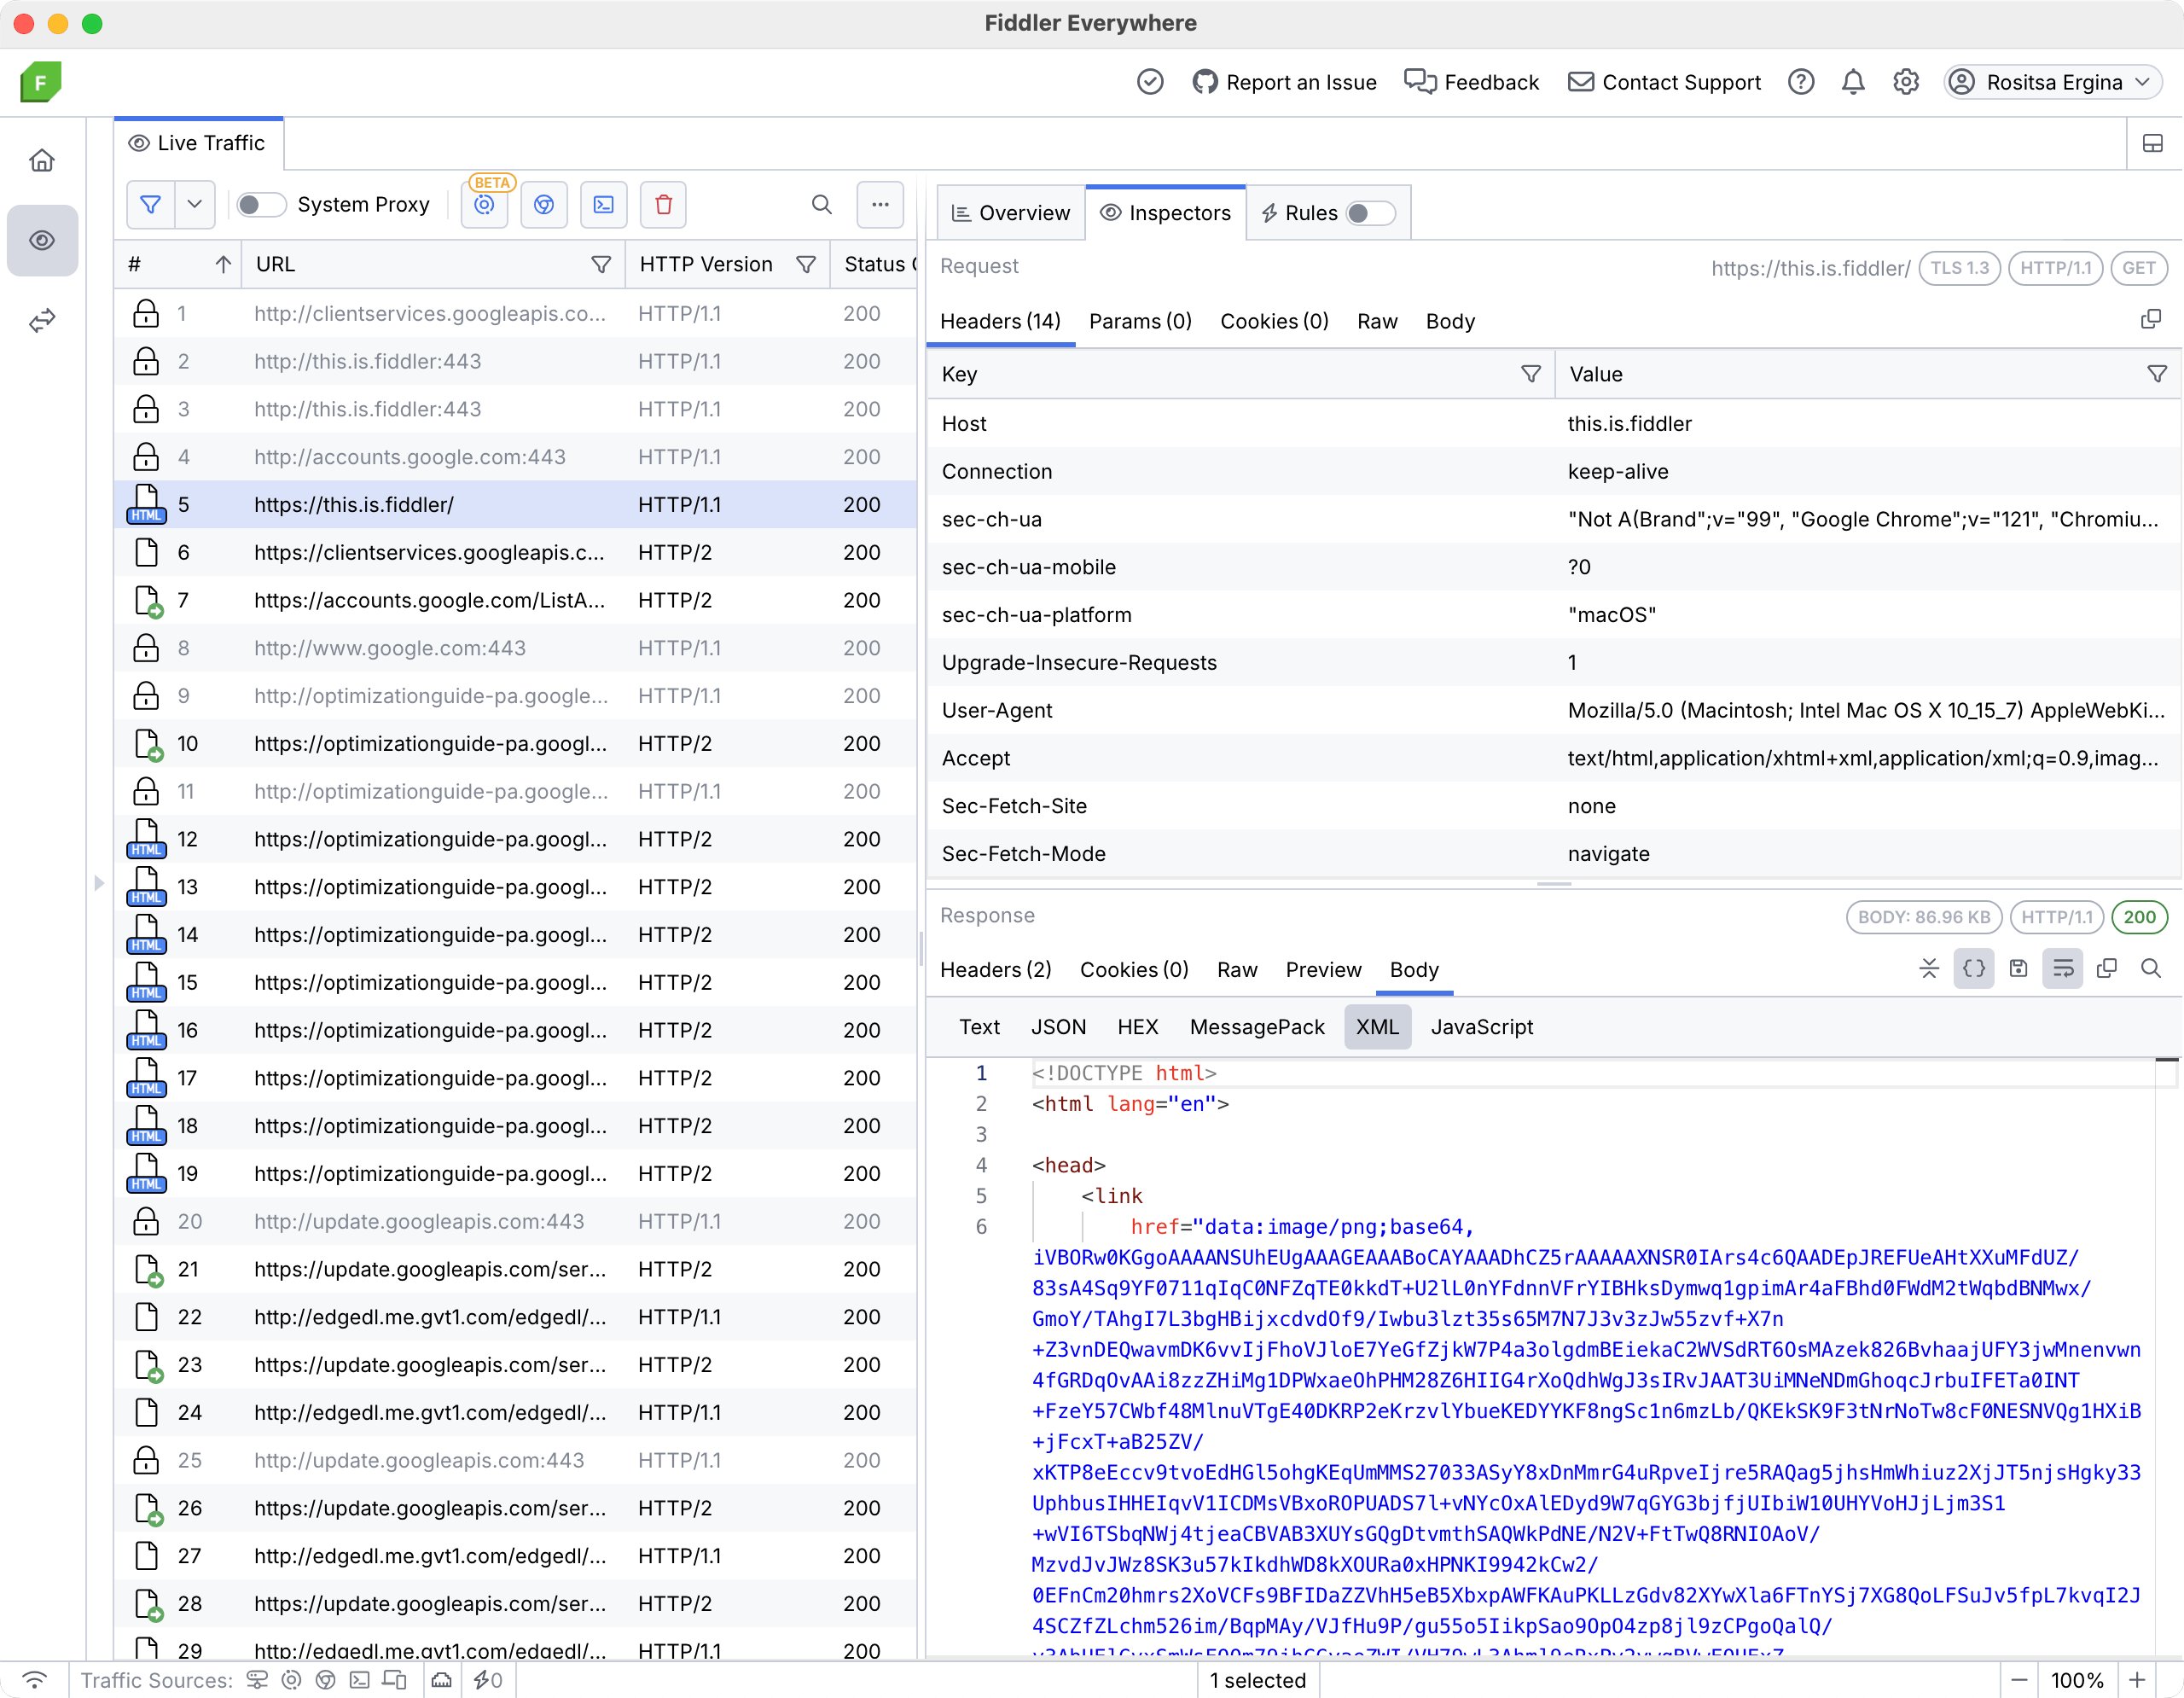
Web debugging proxy tool for MacOS, Windows, and Linux
- Multiple options for capturing, including system proxy, preconfigured browser instance, and preconfigured terminal process
- Support for multiple protocols, including HTTP(S), HTTP/2, WebSocket, and gRPC communication
- Extensive Rules options for modifying traffic
- Advanced filters for precisely narrowing down traffic
- Composer functionality for creating, editing, and saving API requests
- Sharing, saving, and collaboration options
- Regular release cadence and dedicated support
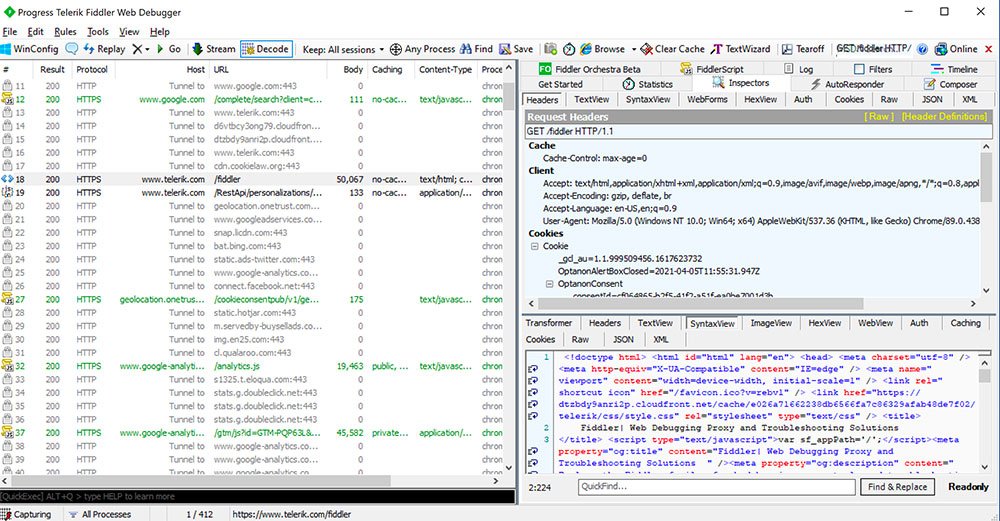
Web debugging proxy for Windows
- System proxy option for traffic capturing
- Decoding and inspection of HTTP(S) requests and WebSocket communication
- AutoResponder rules for modifying traffic
- Basic filter options for narrowing down traffic
- Basic composer functionality for quick API calls and requests edits
- Community support
*Please be aware that Fiddler Classic is not in active development and offers no commitments for releases, patches or tech support. By using this product, you assume all associated risks. We recommend upgrading to Fiddler Everywhere.
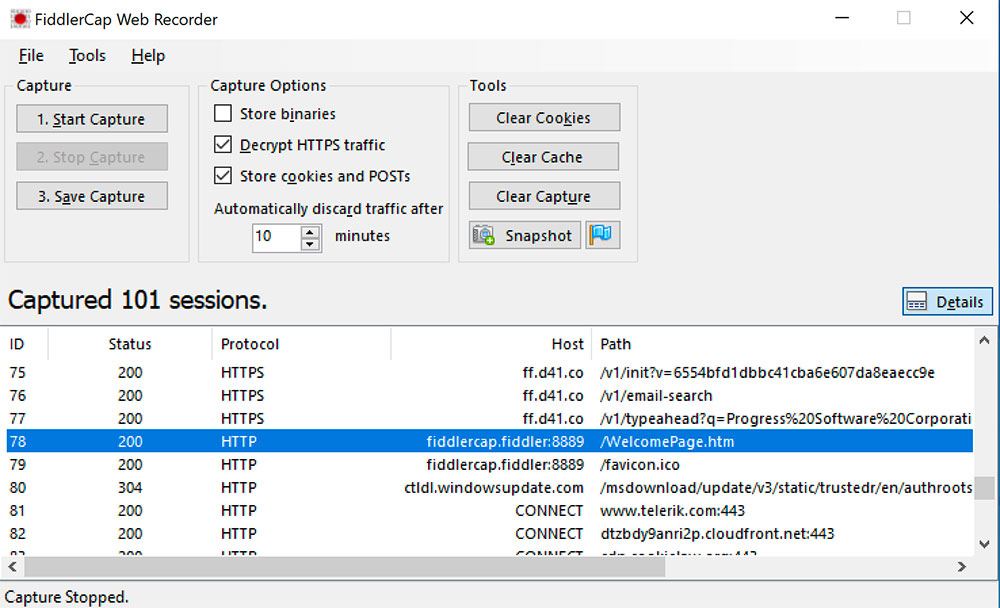
Desktop-based Capture App for Windows
- A Windows only lightweight version of Fiddler designed for data-capture by non-technical users.
- Capture web traffic and quickly send to your tech team for debugging. Eliminating the annoyances derived from hindered communications.
- Share network traffic logs within your teams to jump-start the resolution process.
- Provide end-users a more delightful analysis, communication, and resolution experience.
Embeddable .NET library
- Reliable and powerful .NET library allowing you to capture and modify HTTP and HTTPS traffic to ensure everything works smoothly and securely.
- Harness the power of a stable proxy engine to develop best-in-class features for your .NET solutions and stand out for your ingenuity.
- Discover delays, missing services and threats in minutes not days.
How to Start Your Fiddler Journey

1 Try the Fiddler product(s) that aligns with your needs.
2 Integrate Fiddler into your workflow for rapid, elegant debugging and troubleshooting.
3 You’ll start realizing the high value of benefits of Fiddler through the acceleration of both your time and cost savings.
Hundreds of Thousands of Organizations
are Using Fiddler
Join these companies and the 4 million developers who are already building, running, and debugging with Fiddler.


4.4 Out of 5 Overall User Rating
Don’t just take our word for it. G2 Users have consistently rated Fiddler 4.4 out of 5 stars. G2 is a renowned peer-to-peer review site that aggregates user reviews for business software.
Support & Learning


A Trial of Any of the Fiddler Products Gives You:
- A fully functional version of the software.
- Strict data privacy protection. Your data remains with you, it will never be shared.
- Easy upgrade path to a licensed product.
- Full access to all online documentation, community forums and tutorials.